
Argentina Moved the Global Internet More Than Any Other 2026 World Cup Team


 9 min. read
  Published on

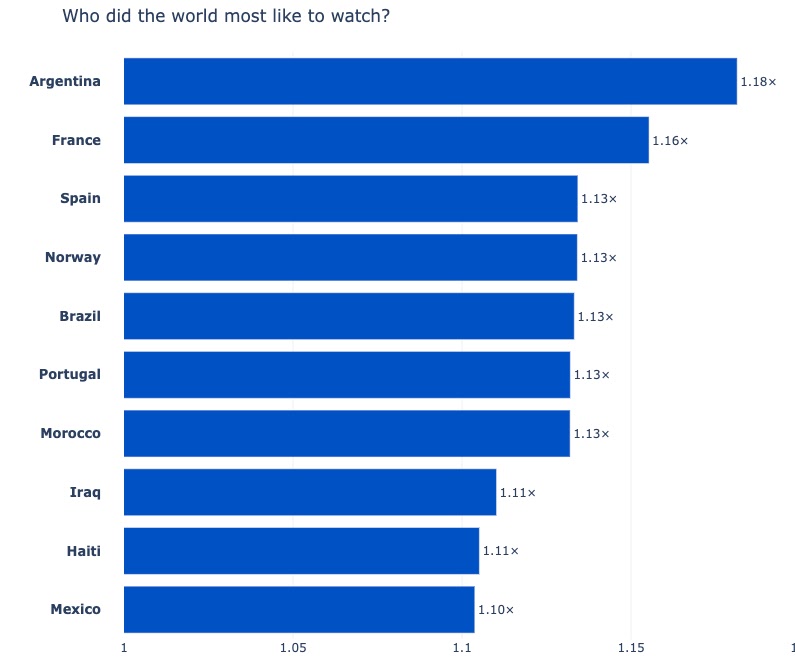
Argentina caused the largest worldwide Internet traffic shifts of any team during the 2026 FIFA World Cup, according to Cloudflare. The defending champions recorded a median global impact factor of 1.17 across their matches.
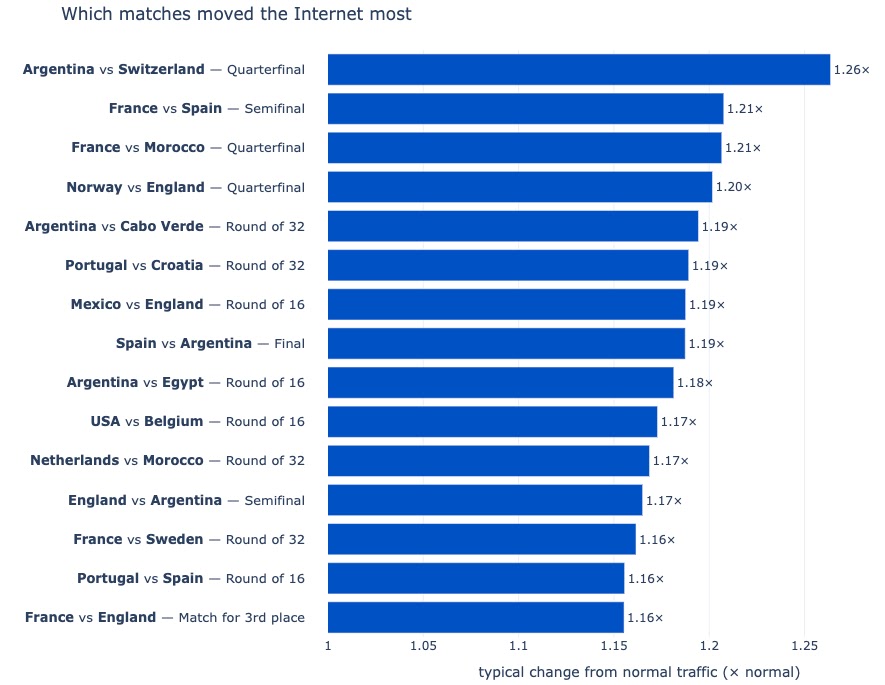
Argentina’s quarterfinal against Switzerland also became the tournament’s most influential individual match. It produced an impact factor of approximately 1.26, ahead of every semifinal and the final.

Access content across the globe at the highest speed rate.
70% of our readers choose Private Internet Access
70% of our readers choose ExpressVPN

Browse the web from multiple devices with industry-standard security protocols.

Faster dedicated servers for specific actions (currently at summer discounts)
The Cloudflare World Cup analysis shows how teams, local kickoff times, streaming habits, halftime, and even brief hydration breaks changed online activity across countries.
Which World Cup teams moved Internet traffic most?
Argentina led the team ranking with traffic moving about 17% away from normal in the typical measured country when it played. Cloudflare calculated the figure from the median worldwide impact across each team’s matches.
France followed Argentina, while Spain and Norway also occupied leading positions. Brazil, Portugal, and Morocco generated substantial worldwide interest, reflecting their large audiences and high-profile players.
Haiti and Iraq appeared as notable outliers. Their matches against larger football nations created disproportionate traffic changes compared with their usual Internet activity.
| Team | Cloudflare finding | Likely attention driver |
|---|---|---|
| Argentina | Highest median worldwide impact at 1.17 | Defending champions and Lionel Messi’s possible final World Cup |
| France | Second-highest overall team impact | Global audience and several prominent players |
| Spain | Among the four leading teams | Deep tournament run and eventual title |
| Norway | Unexpectedly ranked among the leading teams | Strong interest surrounding Erling Haaland |
| Brazil | Produced substantial worldwide movement | Large international following |
| Portugal | Generated significant global attention | Established fan base and high-profile squad |
| Morocco | Ranked prominently across measured countries | Strong regional and international engagement |
Argentina versus Switzerland moved the Internet most
The highest-impact match was Argentina’s quarterfinal against Switzerland on July 11. Argentina won the quarterfinal 3-1 after extra time, advancing to a semifinal against England.
Cloudflare assigned the match an impact factor of about 1.26. France versus Spain ranked second at approximately 1.21, despite taking place later in the tournament.
The result shows that tournament stage alone did not determine online interest. Team popularity, storylines, player recognition, opponent combinations, and kickoff times all affected traffic.
| Match | Tournament stage | Internet impact factor |
|---|---|---|
| Argentina 3-1 Switzerland | Quarterfinal | Approximately 1.26 |
| France versus Spain | Semifinal | Approximately 1.21 |
Cloudflare’s chart also included matches from the round of 32 and round of 16 among the strongest movers. A later match did not automatically create a larger worldwide deviation.
How Cloudflare measured the World Cup’s Internet impact
Cloudflare used HTTP request data collected through its worldwide network, which operates more than 330 points of presence. The measurements covered countries with enough baseline traffic to produce stable results.
The company defined normal activity as the median traffic recorded during the four preceding weeks. It created a per-minute baseline that reduced the influence of daily fluctuations and differences between weekdays and weekends.
Cloudflare Radar then compared current traffic with that baseline using a logarithmic ratio. A score of zero represented normal traffic, while positive and negative values showed increases and declines.
| Score | Meaning |
|---|---|
| 0 | Traffic matched the normal baseline |
| +1 | Traffic reached twice its normal level |
| -1 | Traffic fell to half its normal level |
| Positive value | Traffic rose above the baseline |
| Negative value | Traffic dropped below the baseline |
For each match, Cloudflare examined the two hours following kickoff. It calculated every eligible country’s absolute deviation from normal before taking the median across those countries.
Using absolute values meant that a decline and an increase could both register as strong impact. The figures describe how far traffic moved, not whether worldwide traffic rose by the same percentage.
Cloudflare excluded concurrent group-stage matches because researchers could not reliably assign a country’s traffic change to one specific game when two fixtures were taking place simultaneously.
Overnight matches produced the largest traffic increases
Local kickoff time played a major role in the results. Matches shown between midnight and 8 a.m. often created the largest increases because normal Internet use is relatively low during those hours.
Fans who stayed awake or woke early added substantial activity to an otherwise quiet period. In some countries, traffic reached more than twice its normal overnight level.
Daytime matches generally produced smaller changes because many viewers would already have been online. Evening games sometimes generated a modest increase as football kept people connected when normal usage would otherwise decline.
- Overnight matches commonly pushed traffic well above normal.
- Daytime fixtures often kept traffic close to the existing baseline.
- Evening games created a smaller secondary rise in some countries.
- Local viewing time mattered more than the stadium’s local time.
- The same match could increase traffic in one country and reduce it elsewhere.
Brazil and Japan reacted differently to the same match
Brazil’s round-of-32 match against Japan demonstrated the time-zone effect. The June 29 game occurred during normal waking hours in Brazil but during the middle of the night in Japan.
Japanese traffic remained around a +1 score during the match, meaning it reached roughly twice the normal overnight level. Brazilian traffic fell to approximately -0.4 because viewers stepped away from their usual daytime browsing.
Both countries followed the same match, but their curves moved in opposite directions. For Japanese viewers, streaming and related activity added traffic during a quiet period. In Brazil, football replaced other online behavior.
Halftime divided countries into different groups
Cloudflare grouped countries according to the shape of their match-day traffic. The largest cluster contained 44 countries across 101 matches and showed traffic increasing during halftime and hydration breaks.
A second cluster contained eight countries across 18 matches. Traffic in those countries fell during pauses, producing almost the opposite pattern.
A third cluster consisted only of Iran’s three matches. Cloudflare treated Iran as an outlier because the baseline covered a period when the country’s connectivity remained depressed following an Internet shutdown.
| Traffic cluster | Countries or matches | Observed behavior |
|---|---|---|
| Largest cluster | 44 countries and 101 matches | Traffic increased during halftime and hydration breaks |
| Smaller cluster | 8 countries and 18 matches | Traffic declined during breaks |
| Iran outlier | Iran’s three matches | Traffic appeared unusually high against a depressed baseline |
Streaming explains why some countries disconnected at halftime
Algeria and Austria demonstrated the difference during their June 28 group-stage match. Algeria’s Internet traffic rose sharply after kickoff, fell at halftime, and increased again when the second half began.
Cloudflare found that multimedia and streaming requests drove much of Algeria’s increase. Viewers apparently kept streams active during play but closed them or stepped away during the longer halftime interval.
Austria followed the more common pattern. Its traffic rose during halftime as viewers returned to phones, websites, messaging services, and other online activity before play resumed.
Cloudflare identified Algeria, Tunisia, Jordan, Egypt, and the Democratic Republic of the Congo among the countries where streaming may have shaped this pattern.
Hydration breaks created visible traffic changes
The tournament’s short hydration breaks also left a measurable Internet footprint. Cloudflare compared request peaks around the middle of each half with the five minutes immediately before the expected break.
Traffic increased in many countries as viewers briefly checked their phones. The rise then faded when play restarted, showing that even a pause lasting about three minutes could alter national Internet activity.
Countries dominated by streaming traffic showed a weaker increase or no visible lift. Viewers were less likely to close a stream during a brief in-play pause than during the longer halftime break.
Spain versus Argentina changed traffic during the final
Spain defeated Argentina 1-0 after extra time in the World Cup final on July 19. Ferran Torres scored the only goal in the 106th minute.
Cloudflare found that traffic volume in Spain and Argentina increased by as much as 20 percentage points compared with a similar period. Request patterns also reflected kickoff, hydration breaks, halftime, extra time, and the final whistle.
The bronze-medal match between England and France also coincided with a traffic increase, although Cloudflare recorded a smaller effect than during the final.
The Spain versus Argentina final attracted worldwide attention, but it did not surpass Argentina versus Switzerland in Cloudflare’s match impact ranking.
Traffic to sports betting websites increased
Cloudflare recorded a wider increase in requests to gambling industry websites after the tournament’s opening game. Before the World Cup, betting traffic followed a clear weekly rhythm.
That pattern flattened after the competition began, with requests remaining more consistent throughout the week. Cloudflare linked the change to the near-daily schedule of World Cup matches.
The data establishes a traffic trend rather than the number of individual bettors or the value of wagers. It also does not show that every request represented a completed bet.
What the data means for network operators
Major live events can create sharp traffic changes that resemble operational anomalies when viewed without context. Network teams need baselines that account for geography, local time, content type, and scheduled events.
A surge during an overnight match may represent streaming demand, while a daytime decline may show viewers abandoning ordinary browsing. Halftime can then reverse the direction within minutes.
Operators can use services such as Cloudflare Radar alongside internal telemetry to distinguish expected audience behavior from outages, automated abuse, and denial-of-service attacks.
- Maintain traffic baselines by country, weekday, and time of day.
- Add major sporting events to capacity and monitoring calendars.
- Track multimedia traffic separately from general web requests.
- Compare request volume with match stages and scheduled breaks.
- Prepare streaming infrastructure for overnight demand spikes.
- Avoid treating every sudden traffic change as malicious activity.
The World Cup results show that global Internet traffic does not simply rise when people watch football. It shifts according to when they watch, how they watch, and whether streaming replaces or supplements their usual online activity.
FAQ
Argentina produced the strongest team-level effect, with a median worldwide impact factor of 1.17 across its matches.
Argentina versus Switzerland on July 11 ranked first with an impact factor of approximately 1.26. Argentina won the quarterfinal 3-1 after extra time.
Not necessarily. Cloudflare measured the absolute distance from normal traffic, so both increases and decreases contributed to the match’s impact score.
Normal Internet use is low overnight. Fans who stayed awake or woke early to stream matches added substantial activity, sometimes pushing traffic above twice its usual level.
Many viewers paused their streams or checked phones, websites, and messaging services during halftime. In countries where streaming dominated traffic, usage sometimes fell instead.


Read our disclosure page to find out how can you help VPNCentral sustain the editorial team Read more


Improve this guide



User forum
0 messages