20+ TV Viewership Statistics You Need to Know in 2026

TV viewership statistics offer a unique window into the dynamic world of entertainment consumption.
In our digital era, with endless content on multiple screens, knowing how people connect with TV is a must.
Creators, advertisers, broadcasters, and policymakers prepare for some intriguing TV insights and fun facts!
Let’s delve into TV viewership stats and its growth or decline over the years.
Insightful TV viewership statistics
These are the top enlightening Television trends and patterns you should get familiar with:
- The TV viewership for traditional TV is predicted to increase by +3.66% between 2023 and 2027
- The average person spends 78 thousand hours of their life watching TV
- A typical American child will see at least 16,000 murders on TV
- In 2022 TV commercials reigned over 46% of the ad market value
- Adults in the US spend an average of 2 hours and 33 minutes watching TV each day
- 54% of Americans use streaming services on a TV
- Baby boomers in the US watch 10 or more hours of TV daily
TV households by country
Several factors influence a country’s TV household count. Economic development, TV infrastructure availability, and the cultural significance of television all play crucial roles in shaping these numbers.
The following TV viewership statistics will delve into how households in certain countries engage with television.
1. In 2019, 93.6% of French households had a television
Source [Statista]
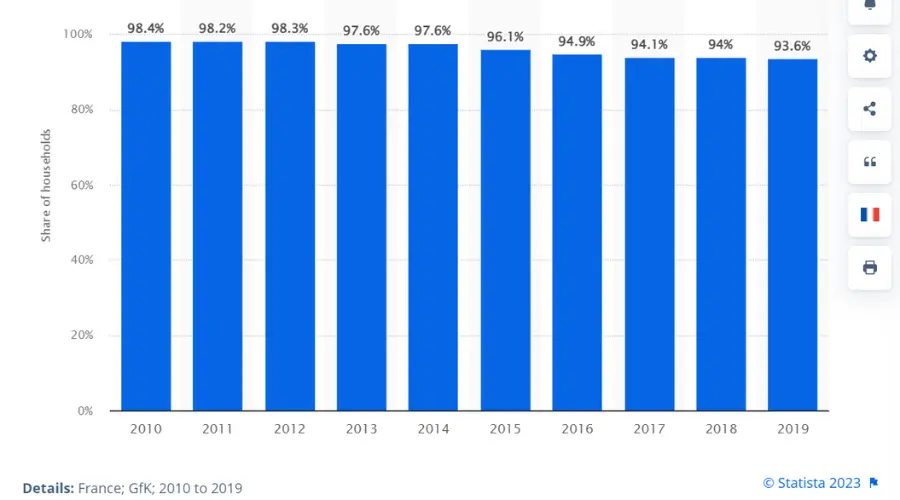
Although the ownership of a TV decreased since 2010, French people of all ages keep watching television. The emergence of connected TV sets and Smart TVs makes it more interesting.
These tools make it easier for residents of France to experience catch-up television.
2. In 2013, 99.3% of households in South Korea had a TV
Source: [Gitnux]
From its early days with HLKZ-TV, television has been vital in Korean culture. It’s now essential for families, providing info, entertainment, and news.
In 2013, citizens in this country relied majorly on analog TV.
However, as time went on, digital TV sets became so popular that in 2022, the common household in South Korea owned an average of 1.21 digital TVs.
3. In 2021, China had over 325.3 million paid-TV subscriptions
Source [Statista]
China dominates in the Asia-Pacific region with an amazing number of subscriptions – over 325 million.
These statistics demonstrate the huge TV viewership in the nation.
Statista’s forecasts also show that the market will continue to grow, with an expected 345 million subscriptions by 2027, highlighting China’s continued dominance in the pay-TV market.
4. In 2020, 96% of US households owned at least one television set
Source: [Gitnux]
The prevalence and popularity of TV in the US have increased exponentially over the years.
In 2017 for example, the highest television ownership among top countries was noticed in the US, with 95.8% of houses having at least one TV.
Current data shows that it continues to grow.
5. 99% of households in Australia had a TV in 2009
Source: [Research Gate]
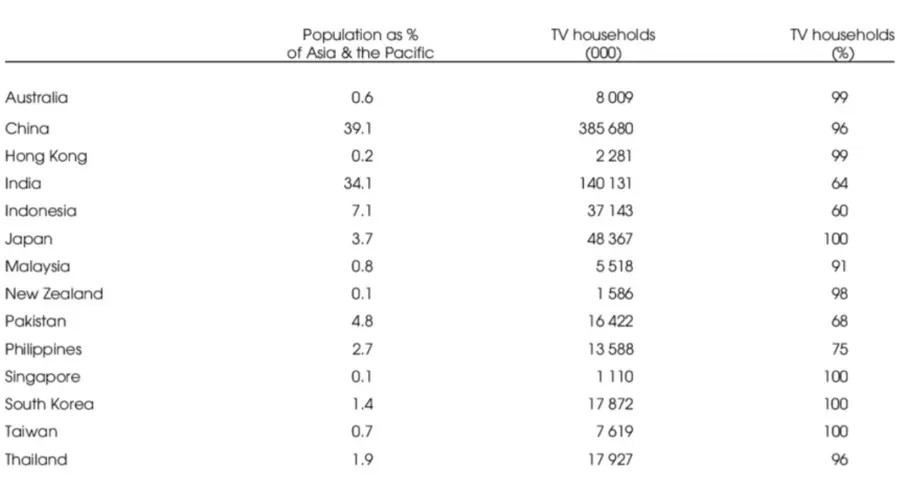
In the same month and year, 96% of homes in China had a television set. The percentage of households with TV in the following countries was recorded during the same period:
- Hong Kong – 99%
- India – 64%
- Indonesia – 60%
- Japan – 100%
- Malaysia – 91%
- New Zealand – 98%
- Pakistan – 68%
- Philippines – 71%
- Singapore – 100%
- Thailand – 96%
6. About 210 million Indian households owned a television set in 2021
Source: [Hindu Business Line]
According to the Broadcast Audience Research Council (BARC), India, this is a 6.60% increase of the 197 million homes with TV sets in 2018.
In 2020, the number of TV viewers increased by 6.7%. It reached a total of 892 million, up from 836 million in 2018. This marks an additional 57 million viewers in just two years.
BARC also found out that TV households in Urban markets grew by four percent, from 87.8 million in 2018 to 91 million in 2020.
On the other hand, rural markets have only increased by 9% from 108.9% million to 119.2 million in 2020.
7. 8 of the top 10 countries by households with television were European in 2004
Source [Nation master]
Cyprus ranked first for households with television in Europe in 2004.
The TV viewership statistics also show that 6 of the highest-ranking countries are high-income OECD (Organisation for Economic Co-operation Development).
TV consumption by country
This analysis of TV consumption will explore the varied ways in which people around the world use this form of entertainment.
8. 54% of Americans use streaming services on a TV
Source [Ipsos]
On the other hand, 36% of Americans, especially Gen-Z and Millennials (52% and 46% respectively) use streaming services like Netflix and Hulu on their phones and tablets.
Ipsos found that only 1 in 5 Millennials and a quarter of Gen Z (25%) have cable TV compared to nearly half of all baby boomers (49%).
9. A typical American child will see at least 16,000 murders on TV
Source: [Gitnux]
A 2022 survey revealed that by age 18, the typical American would have witnessed 16,000 murders and 200,000 acts of violence on TV.
This prevalence can be attributed to the fact that 66% of TV programs feature chaotic actions.
Also worth noting is that in 45% of violent movies, the wrongdoers do not face consequences for their actions.
10. Over 80% of UK households owned a flat-screen TV in 2021
Source: [Gitnux]
There are a few reasons why flat-screen televisions have become so popular in the UK.
First, they are more affordable than they used to be.
Second, they offer a better viewing experience than traditional CRT televisions.
Third, they are available in a variety of sizes and styles to suit any home.
Also, television broadcasters had to adapt their programming to take advantage of the larger screens and better picture quality.
11. In 2015, 96% of the households in the Philippines possessed a TV
Source: [Gitnux]
This TV viewership stat suggests that in 2015, broadcast television was the major medium of transmission for entertainment, news, and shows for Filipinos.
Finally, the government also regulated the television industry, providing a wide variety of programming available to viewers.
1. In 2018, viewers in Russia averaged 248 minutes per day watching TV
Source: [World Atlas]
Television has always played an important role in Russian society. It is a way for people to stay informed about current events, and enjoy entertainment.
In fact, in 2018, 75% of the Russian population watched national TV as a habit. The country even has more than 3300 channels and most of them are broadcast in native languages.
TV viewership by time of day
This section explores how TV viewership changes throughout the day.
13. Adults in the US spend an average of 2 hours and 33 minutes watching TV each day
Source [Statista]
US adults have been watching less TV over the years. This trend is expected to continue with the rise of mobile devices and on-demand streaming.
Younger generations prefer streaming on smartphones, indicating a further decline in TV screen time. However, in 2020, the trend shifted due to increased TV usage during the Coronavirus outbreak.
Estimates indicate that by 2026, only 57.2 million US households will subscribe to home TV cable services, down from 100 million in 2014.
14. Baby boomers in the US watch 10 or more hours of TV daily
Source [Ipsos]
A baby boomer is someone who was born between 1946 and 1964. Ipsos conducted a poll and the results showed that about half of this generation in the US watch the most TV in a week.
Then, two in five of the American boomers (39%) accepted that they had binge-watched TV in the past three months while only 1 in 6 Gen Z and a quarter of Millenials watched that much TV.
15. A study in 2018 showed that 88% of Americans watch more TV in the evening
Source [Statista]
According to a study done in the US in November 2018, the majority of individuals preferred to watch TV in the evening.
A significant 88% of Americans reported watching more TV in the evenings, according to the survey. On the other hand, the hours between midnight and six in the morning saw a decline in TV viewership.
16. The average person spends 78 thousand hours of their life watching TV
Source: [Study Finds]
In a study by OnePoll in 2019, it was discovered that people tend to spend at least 3.5 hours watching television daily on average.
This equals to 1248 hours yearly and approximately 78 thousand hours an entire lifetime.
Furthermore, the survey showed that the average adult would watch 3639 movies at home, 31, 507 episodes of TV, and at least 11, 278 different series their entire life.
17. Older and unemployed people watched the most TV between 2013 -2017
Source: [US Bureau of Labor Statistics]
Results from a survey done between 2013 and 2017 showed that older people and those who were not employed spent the most time watching TV.
Specifically, people aged 55 to 64 watched an average of 3 hours and 14 minutes of TV per day, while those aged 65 and older watched even more, averaging 4 hours and 14 minutes per day.
Additionally, people who were not employed, regardless of age, watched TV for an average of 3 hours and 49 minutes per day.
On the other hand, parents of young children had the least amount of TV time, with those whose youngest child was under 6 years old averaging 1 hour and 50 minutes per day.
18. The number of global viewers of traditional TV is predicted to increase by +3.66% between 2023 and 2027
Source [Statista]
According to Statista, the number of TV viewers that watch Traditional TV and Home Video worldwide will increase between 2023 and 2027 by 0.2 billion users (+3.66%).
A new peak would appear in 2027 as the indicator is estimated to reach 5.69 billion users.
Television advertising statistics
The following statistics provide insights into the reach and effectiveness of television advertising.
19. In 2022, connected TV advertising spending in the US was valued at $20.69 billion
Source [Statista]
Advertising on connected TVs (CTVs) is constantly growing at a high rate and it combines the ease of online advertising with the reach of TV.
It incorporates customized skippable ads for the target audience while streaming TV content. In 2027, money spent on CTV ads is projected to rise to 40.9 billion US dollars.
20. The total TV ad spending in France in 2022 was about 3.4 billion euros
Source: [Statista]
France started playing around with broadcasting in 1931 and added color TV in 1967. They allowed private ads on TV in 1968, showing two minutes of ads each day on one channel.
The 1980s were a great time for cool ads in France, with brands like Peugeot and Cooper Jeans making stylish ads.
However, in 2009, ex-president Nicolas Sarkozy changed things by stopping TV ads during the evening on four big public channels.
Even so, service providers and brands still use TV as their main means of advertising.
21. A survey in 2022 showed that most Nigerian households owned a TV
Source: [Statista]
The majority of the households, about 70.4%, in Nigeria that owned a TV set were in the urban area.
At the same time, around 36% of the people surveyed declared that a member of their family had one.
22. In 2022, money spent on TV ads in Western Europe amounted to 28.8 billion US dollars
Source: [Statista]
Despite the emergence and increased popularity of digital media streaming in Europe, TV advertising has maintained a rather dominant position and it varies from region to region within the continent.
Statistics also show that TV viewership in Europe increases every year, hence encouraging companies to compete for positions on these channels to promote their products and services.
23. In 2022 TV commercials reigned over 46% of the ad market value
Source: [Statista]
In Germany, the newspaper proves to be the second-largest advertising medium, with 32 percentage points. In 2022, Germany made about 4.7 billion euros from TV ads.
However, experts think this number won’t go up until 2026. Instead, it might even go down for a while.
Only online TV ads are expected to increase a bit each year, but they’re just a tiny part of all the money Germany spends on TV ads.
24. Television advertising spending in the UK reached an estimated 5.4 billion British pounds in 2022
Source: [Statista]
The United Kingdom is said to have the largest TV advertising market in Europe. Numbers show that there’s been an increase in households with TV in the UK in the last decade before reaching an estimated 27 million.
UK advertising becomes particularly evident during Christmas, triggering an annual frenzy throughout the country with the introduction of festive advertisements.
Sadly, the latest forecasts suggest that growth will taper off in the future. Nonetheless, the elevated spending level underscores television’s continued importance as a crucial asset for advertisers.
25. Viewers don’t pay attention to 55% of TV advertising-time
Source: [Think with Google]
People multitask while watching TV, which means they are not paying full attention to the ads. They may be checking their phones, browsing the internet, or doing something else during TV commercials.
Many others have DVRs or streaming services that allow them to skip commercials. This means that they are not even seeing the ads in the first place.
RELATED:
- How to watch European TV in the USA
- Is it Legal to Watch Foreign TV with a VPN?
- How to watch TV channels from another country
- How to change region on Samsung TV
Summary
Based on statistics, the ongoing decrease in traditional TV viewership is a trend expected to persist in the foreseeable future.
Streaming services provide a more convenient and adaptable means of consuming television content, consistently introducing fresh programming.
As a result, traditional TV providers will need to find new ways to compete in the streaming era.
FAQ
What is the highest TV viewership ever?
The highest recorded TV viewership is estimated to be 5.1 billion viewers, for the funeral of Queen Elizabeth II on September 19, 2022.
It was broadcast live in over 160 countries, and it is estimated that over 750 million people watched it in the United Kingdom alone.
Is TV viewership declining?
Yes, worldwide TV viewership is indeed on the decline. In the United States, for example, the average American watched 4 hours and 39 minutes of traditional TV per day in 2022, down from 5 hours and 4 minutes in 2019.
This decline is attributed to the rise of streaming services, which offer viewers a wider variety of content that they can watch on demand.
What percentage of the world owns a TV?
An estimated 79% of households worldwide have at least one television set. This means that about 1.4 billion households have a TV, out of a total of 1.8 billion households
Sources
Read our disclosure page to find out how can you help VPNCentral sustain the editorial team Read more

Improve this guide


User forum
0 messages