In-Browser Data Inspection Helps Analysts Track Phishing Attack Flows Inside Browser Sessions

ANY.RUN has introduced in-browser data inspection for URL analysis, giving security analysts a browser-level view of how phishing pages behave after a suspicious link is opened.
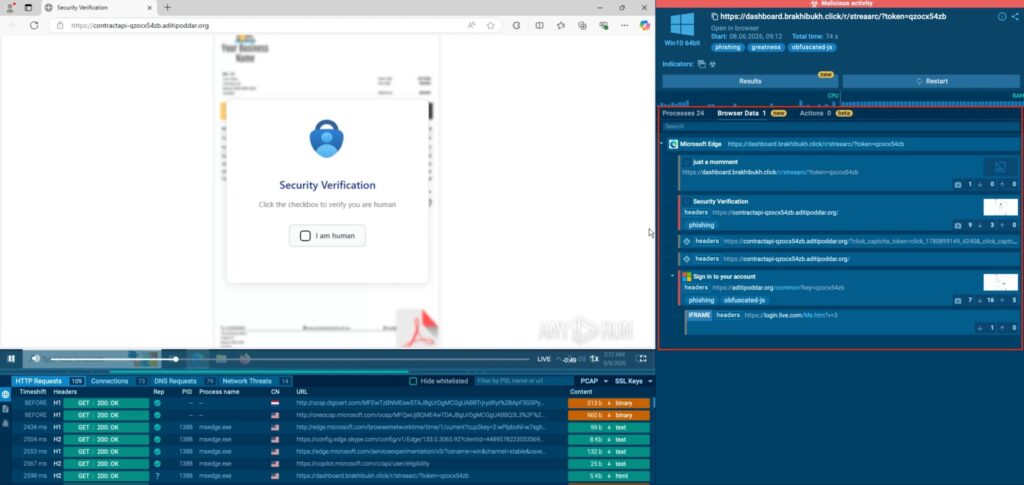
The feature, described in ANY.RUN’s report, captures redirects, scripts, HTTP requests, iframe activity, DOM changes, screenshots, indicators, and rendered page content in one workflow.

Access content across the globe at the highest speed rate.
70% of our readers choose Private Internet Access
70% of our readers choose ExpressVPN
Browse the web from multiple devices with industry-standard security protocols.

Faster dedicated servers for specific actions (currently at summer discounts)
The goal is to close a major gap in phishing investigations. Modern phishing pages often change after loading, hide code behind client-side scripts, redirect users through several stages, and show different content depending on location, browser behavior, or user interaction.
Phishing investigations need browser-level visibility
Security teams often investigate suspicious URLs by combining screenshots, redirect tracing, network logs, static page inspection, and sandbox results. That process can slow down triage and still miss the details that only appear during real browser execution.
Phishing is also not limited to simple credential pages anymore. Attackers use links to route victims through fake login pages, file-sharing lures, CAPTCHA screens, cloud-document themes, and staged credential collection flows.
The MITRE ATT&CK spearphishing link technique explains that attackers use malicious links to direct victims toward phishing sites or malware delivery paths, helping them avoid defenses that focus mainly on attachments.
| Traditional URL review problem | What in-browser inspection adds |
|---|---|
| Only a final screenshot is visible | Shows the full path from initial URL to final rendered page |
| Redirects must be reconstructed manually | Displays the execution tree, redirects, and activated iframes |
| Static scanners miss injected code | Shows DOM changes after the page loads |
| Analysts switch between several tools | Combines browser telemetry, content, and indicators in one view |
| Escalations lack enough evidence | Provides a fuller evidence package for Tier 2 or incident response teams |
How in-browser data inspection works
The suspicious URL is opened in a real browser environment inside ANY.RUN’s Interactive Sandbox. As the page executes, the platform records what the browser sees and does, rather than relying only on static page content.
Analysts can use the Browser Data tab to review the page execution tree, HTTP requests, redirects, responses, triggered signatures, domain and IP statistics, screenshots, and related indicators.
The HTML DOM Changes tab shows code fragments added after the page loaded. This matters because phishing pages often inject forms, scripts, or hidden elements dynamically, which means a static scan may not show the full attack flow.
- Analysts can see the initial URL and every redirect stage.
- Activated iframes appear in the execution tree.
- HTTP requests and responses can be reviewed in context.
- DOM changes reveal code added after the page loads.
- Indicators such as domains, IP addresses, URLs, and hashes are collected for pivoting.
The feature can speed up SOC triage
For SOC teams, speed matters. A suspicious URL may look harmless at first, then turn malicious after a redirect, script execution, or user interaction. Without browser-level evidence, analysts often escalate cases because they cannot confidently classify the link.
In-browser inspection gives analysts a clearer view of what the victim would have seen. That helps Tier 1 teams make faster decisions and gives senior analysts better context when escalation is still needed.
The CISA phishing guidance notes that malicious actors use phishing to steal login credentials and deploy malware for follow-on activity. That makes fast URL triage important because one missed link can lead to account compromise or wider intrusion.
| SOC task | How browser-level evidence helps |
|---|---|
| Initial triage | Shows whether the link produces suspicious redirects, forms, or scripts |
| Escalation | Packages the browser session, screenshots, indicators, and network flow |
| Threat hunting | Collects domains, IP addresses, file hashes, and page artifacts |
| Detection engineering | Provides material for IDS rules, YARA rules, and infrastructure pivots |
| Incident response | Helps teams understand what users saw and what data may have been submitted |
Indicators can be used beyond one phishing page
ANY.RUN says analysts can pivot from a single URL into related infrastructure. Collected indicators can include domains, IP addresses, URLs, and hashes associated with the analyzed page.
The company also says content from browser snapshots can help create YARA hunting and detection rules. In one example, a YARA rule built from a single phishing page snapshot identified 145 related samples in ANY.RUN Threat Intelligence Lookup and YARA Search.
That kind of pivoting is useful because phishing kits often reuse templates, scripts, page fragments, hosting patterns, or infrastructure. A single page can point analysts toward a larger campaign if the investigation captures enough browser-level evidence.
Why static analysis can miss modern phishing behavior
Static tools can still help, but they do not always capture what happens after a page loads. Many phishing pages build their credential forms through JavaScript, redirect users based on browser checks, or hide content until the page receives a specific interaction.
Some campaigns also use iframes, short-lived infrastructure, CAPTCHA gates, and staged loading to reduce what automated tools can see. In those cases, the final page alone does not explain how the attack worked.
The ANY.RUN analysis argues that browser telemetry, page content, behavioral evidence, and threat intelligence need to sit in the same investigation view so analysts do not have to rebuild the attack manually.
| Phishing behavior | Why it can be missed | What analysts should inspect |
|---|---|---|
| Layered redirects | Final URL does not show the full path | Execution tree and HTTP request history |
| Injected login forms | The form may not exist in the original HTML | DOM changes after page load |
| Iframe-based content | Credential collection may happen in embedded pages | Activated iframe activity |
| Script-driven behavior | Static scanners may see only partial code | Runtime script execution and network requests |
| Campaign reuse | One page may look isolated | Indicators, snapshots, and YARA pivots |
Better phishing evidence improves response quality
When analysts have the full browser session, they can make clearer decisions. They can see whether a URL only redirected to a harmless landing page, whether it loaded a fake login form, whether it contacted suspicious infrastructure, or whether it tried to collect credentials.
This also improves handoffs. Instead of sending a short note that a URL “looks suspicious,” analysts can share a structured view that includes the rendered page, redirects, requests, detections, and indicators.
The MITRE spearphishing link entry highlights why links remain a major initial-access path. Attackers can use them to direct users to malicious sites without attaching a file, which makes URL analysis a central part of phishing defense.
- Collect the full redirect chain before closing a phishing case.
- Review DOM changes, not only the original HTML source.
- Check iframes and third-party scripts loaded during execution.
- Extract domains, IPs, URLs, and hashes for wider hunting.
- Use rendered screenshots to show what the victim actually saw.
- Turn reusable page artifacts into YARA or other detection logic where possible.
In-browser inspection is becoming a baseline SOC requirement
Phishing volume and sophistication continue to make URL triage a daily pressure point for SOC teams. Browser-level evidence can reduce guesswork, shorten investigation time, and help teams spot dynamic behavior that static tools miss.
That does not mean analysts should abandon other controls. Email filtering, user reporting, authentication logs, endpoint telemetry, and network detections still matter. In-browser inspection strengthens the investigation layer by showing what happened inside the session itself.
The CISA guidance recommends user reporting, suspicious-link awareness, and layered defenses to reduce phishing impact. Browser-session evidence gives SOC teams another way to validate reports and respond before a single clicked link becomes a larger incident.
FAQ
In-browser data inspection is a URL analysis method that captures what happens when a suspicious page runs inside a real browser. It records redirects, HTTP requests, iframes, DOM changes, scripts, screenshots, and indicators so analysts can understand the full phishing flow.
Modern phishing pages often change after loading, use scripts, activate iframes, and redirect users through several stages. Browser-level visibility helps analysts see what a victim actually experienced instead of relying only on static page data.
The Browser Data tab shows the page execution tree, redirects, activated iframes, HTTP requests and responses, screenshots, detections, DOM changes, and related indicators such as domains, IP addresses, URLs, and hashes.
It can reduce manual work by putting dynamic browser evidence, page content, screenshots, requests, redirects, and indicators in one view. This helps Tier 1 analysts triage URLs faster and gives senior analysts better evidence during escalation.
Yes. Indicators and page artifacts collected during browser execution can help analysts pivot into related infrastructure. ANY.RUN says a YARA rule built from one phishing page snapshot identified 145 related samples in its threat intelligence database.
Read our disclosure page to find out how can you help VPNCentral sustain the editorial team Read more

Improve this guide


User forum
0 messages